


Daily Technical Analysis: US Dollar Rises Against Major Currencies, USDJPY Breaks Above 145.00

USD JPY shows a strong uptrend on the hourly chart, evidenced by a clear series of higher highs and higher lows. After bottoming around 141.75, price surged to a recent high near 145.91 before slightly pulling back.
The short-term MAs (5 and 10) are still above the 30-period MA, confirming bullish direction.
Price is slightly correcting but still above the 30 moving average, indicating this might be a healthy retracement. RSI shows a loss of momentum, but not a reversal yet.
As long as price remains above the 30 MA (around 144.50), buyers remain in control. It’s important to watch for support near 144.80–145.00 for potential bullish entries. A break below that could signal deeper correction.
USDJPY 1H Chart
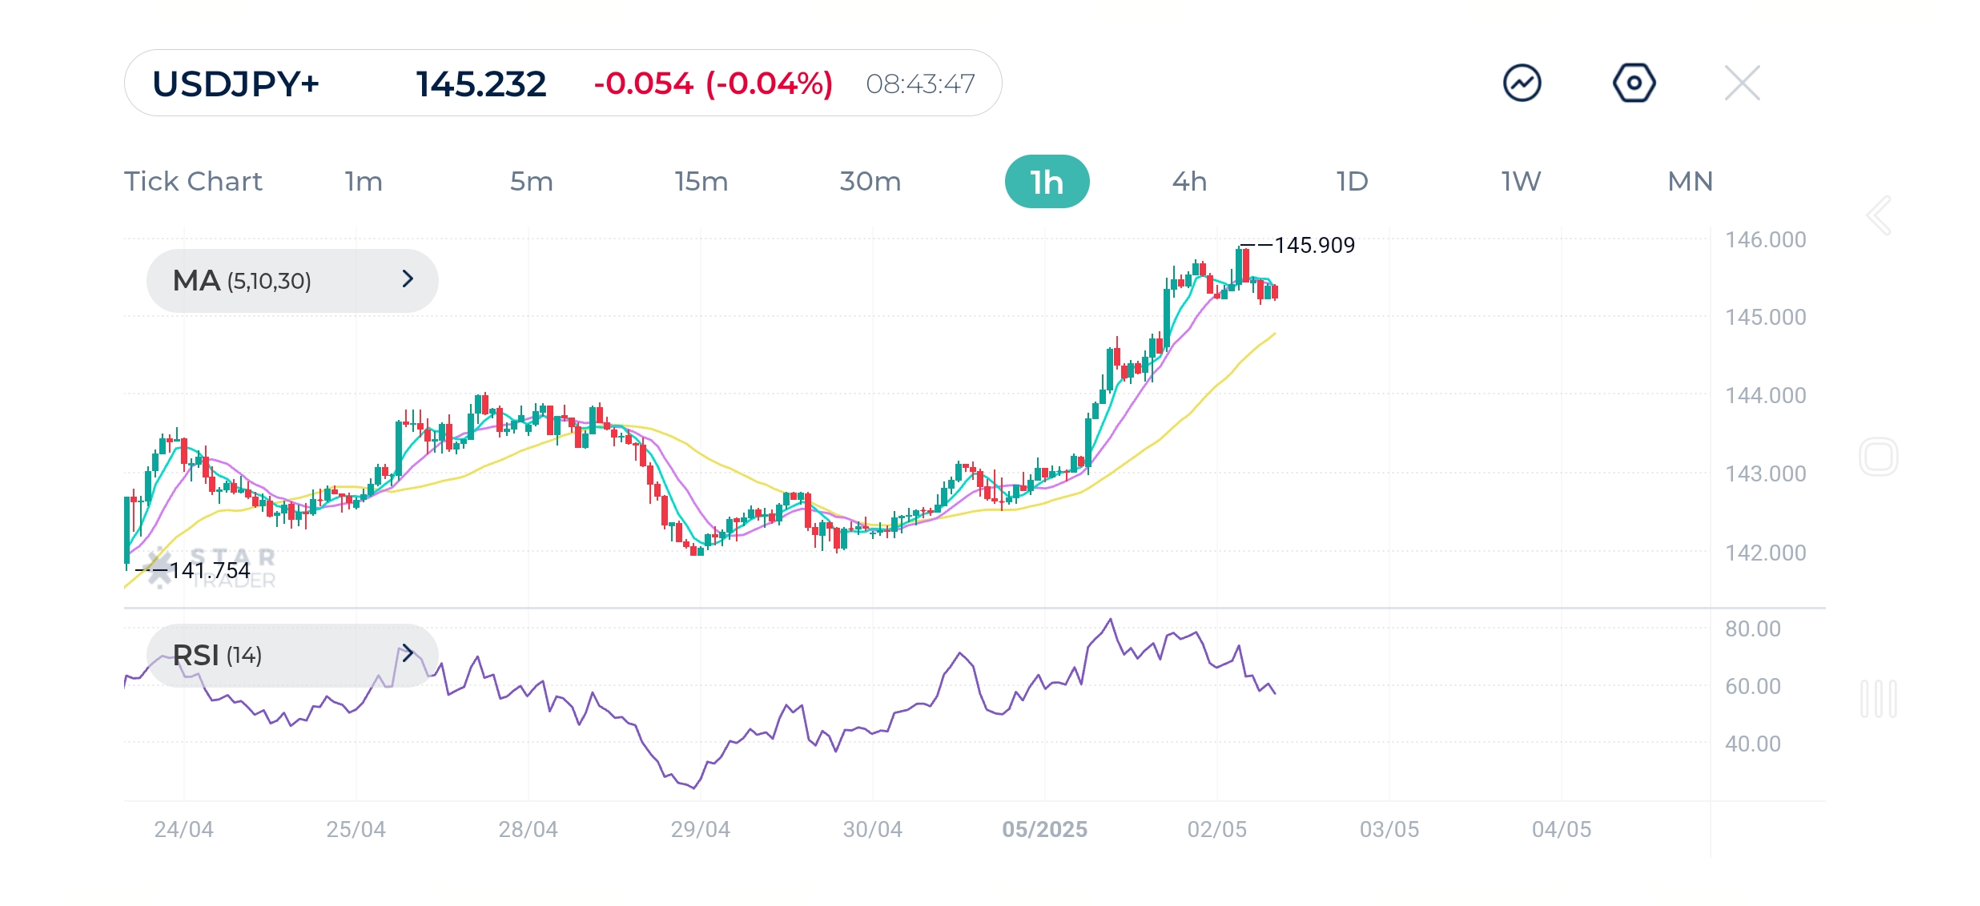
| Resistance | 145.93 | 146.45 | 147.16 |
| Support | 144.56 | 144.15 | 143.69 |
EURUSD is in a downtrend, confirmed by lower highs and lower lows. Trendline shows decline from the recent high of 1.1424. Short term moving averages are trending downward, though recent candles are attempting to break above the MA cluster, signaling a potential reversal attempt. Price is currently testing both the 10 and 30 MAs, a critical resistance zone.
RSI is recovering and approaching the 50–60 zone, indicating bullish bias, but not yet strong
A break and close above 1.1320–1.1340 (above moving averages + trendline) would be bullish for the pair, targeting 1.1370 and 1.1400. If it fails at this resistance, expect a retest of 1.1265 (recent low).
EURUSD 1H Chart
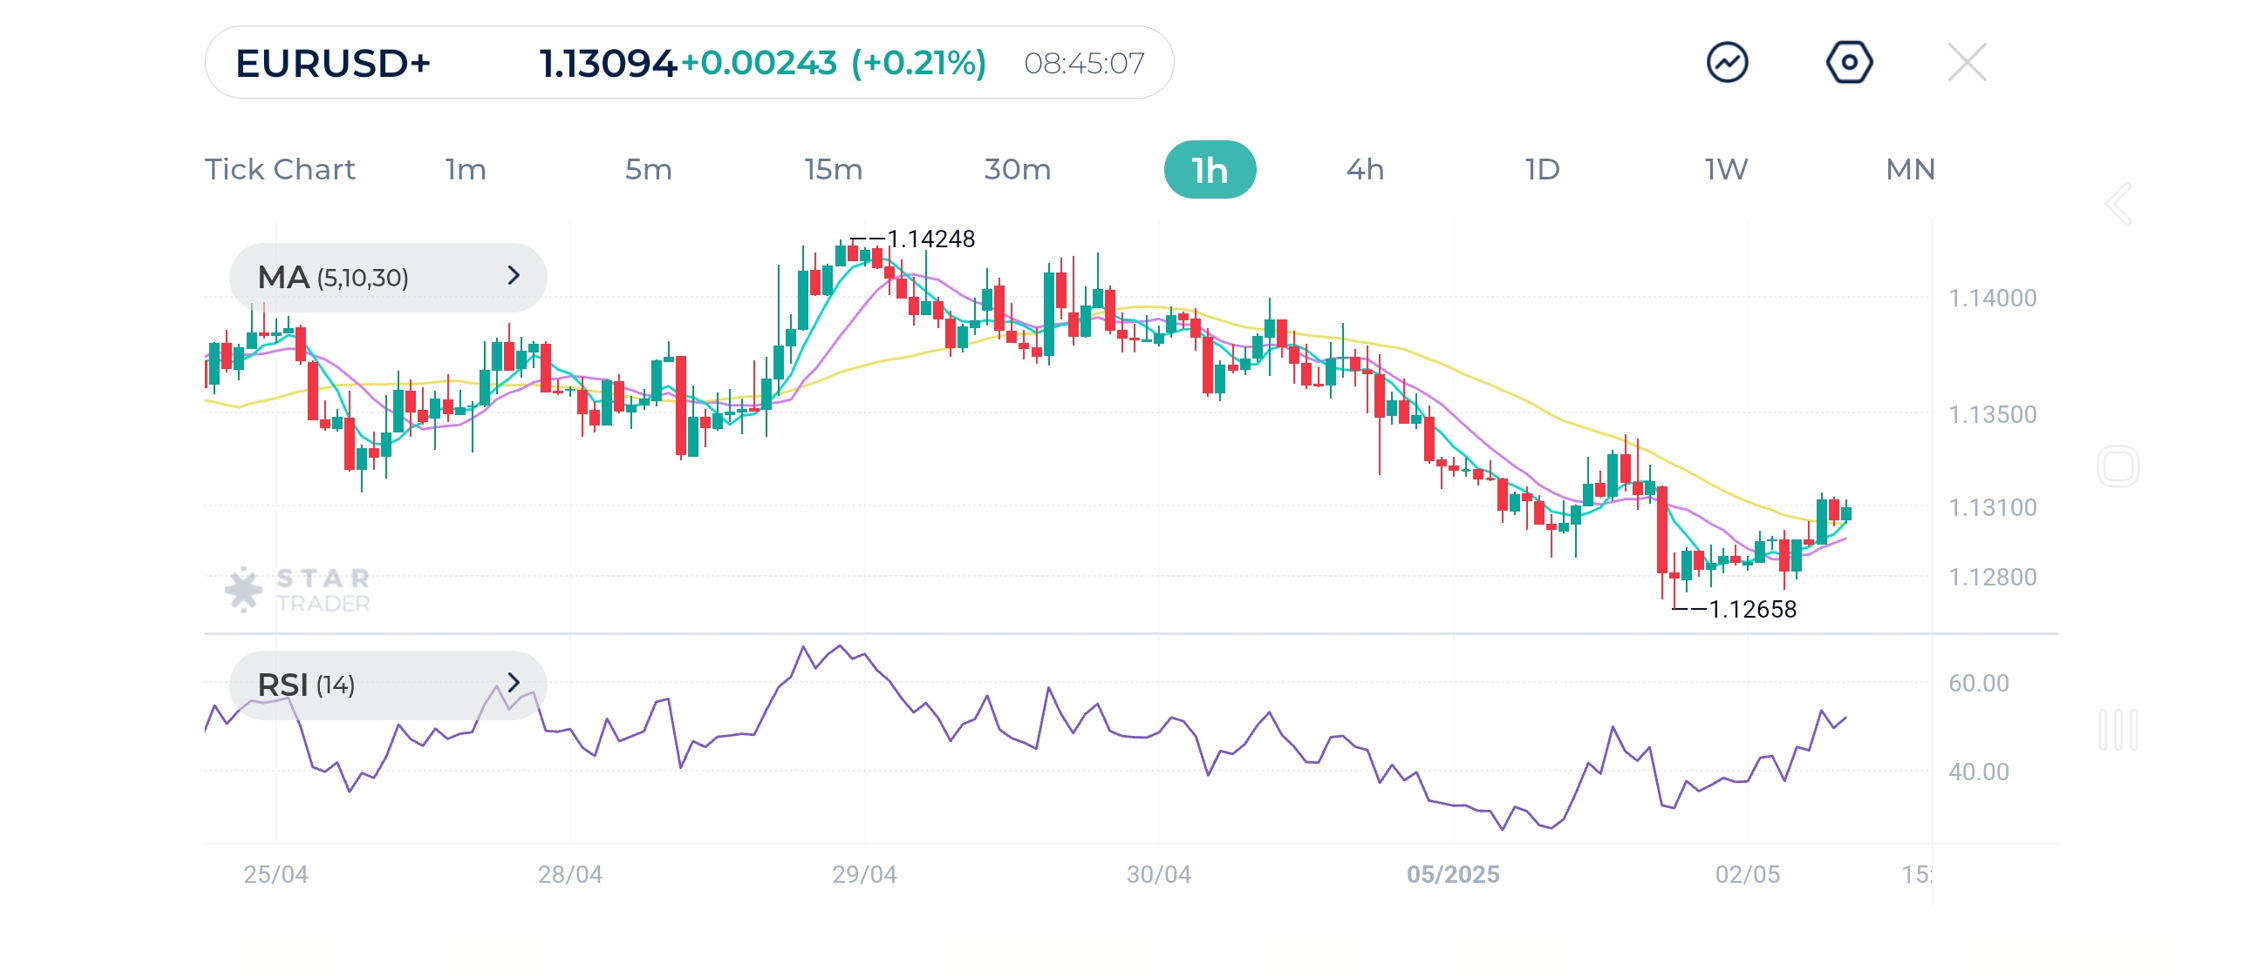
| Resistance | 1.1328 | 1.1341 | 1.1365 |
| Support | 1.1274 | 1.1266 | 1.1249 |
Oil shows Clear downtrend from 64.08 to 56.61, followed by a strong bounce. The bounce pushed price back to near $60, testing prior minor resistance.
Short term moving averages MAs (5 and 10) have crossed above the 30 moving average a bullish crossover. Price is consolidating just under 60.00, which might act as short-term resistance.
If price breaks and holds above $60, bullish movement is likely towards $61.50–62.00. However, failure to break may lead to a pullback to support at $58.50.
Oil1 H Chart
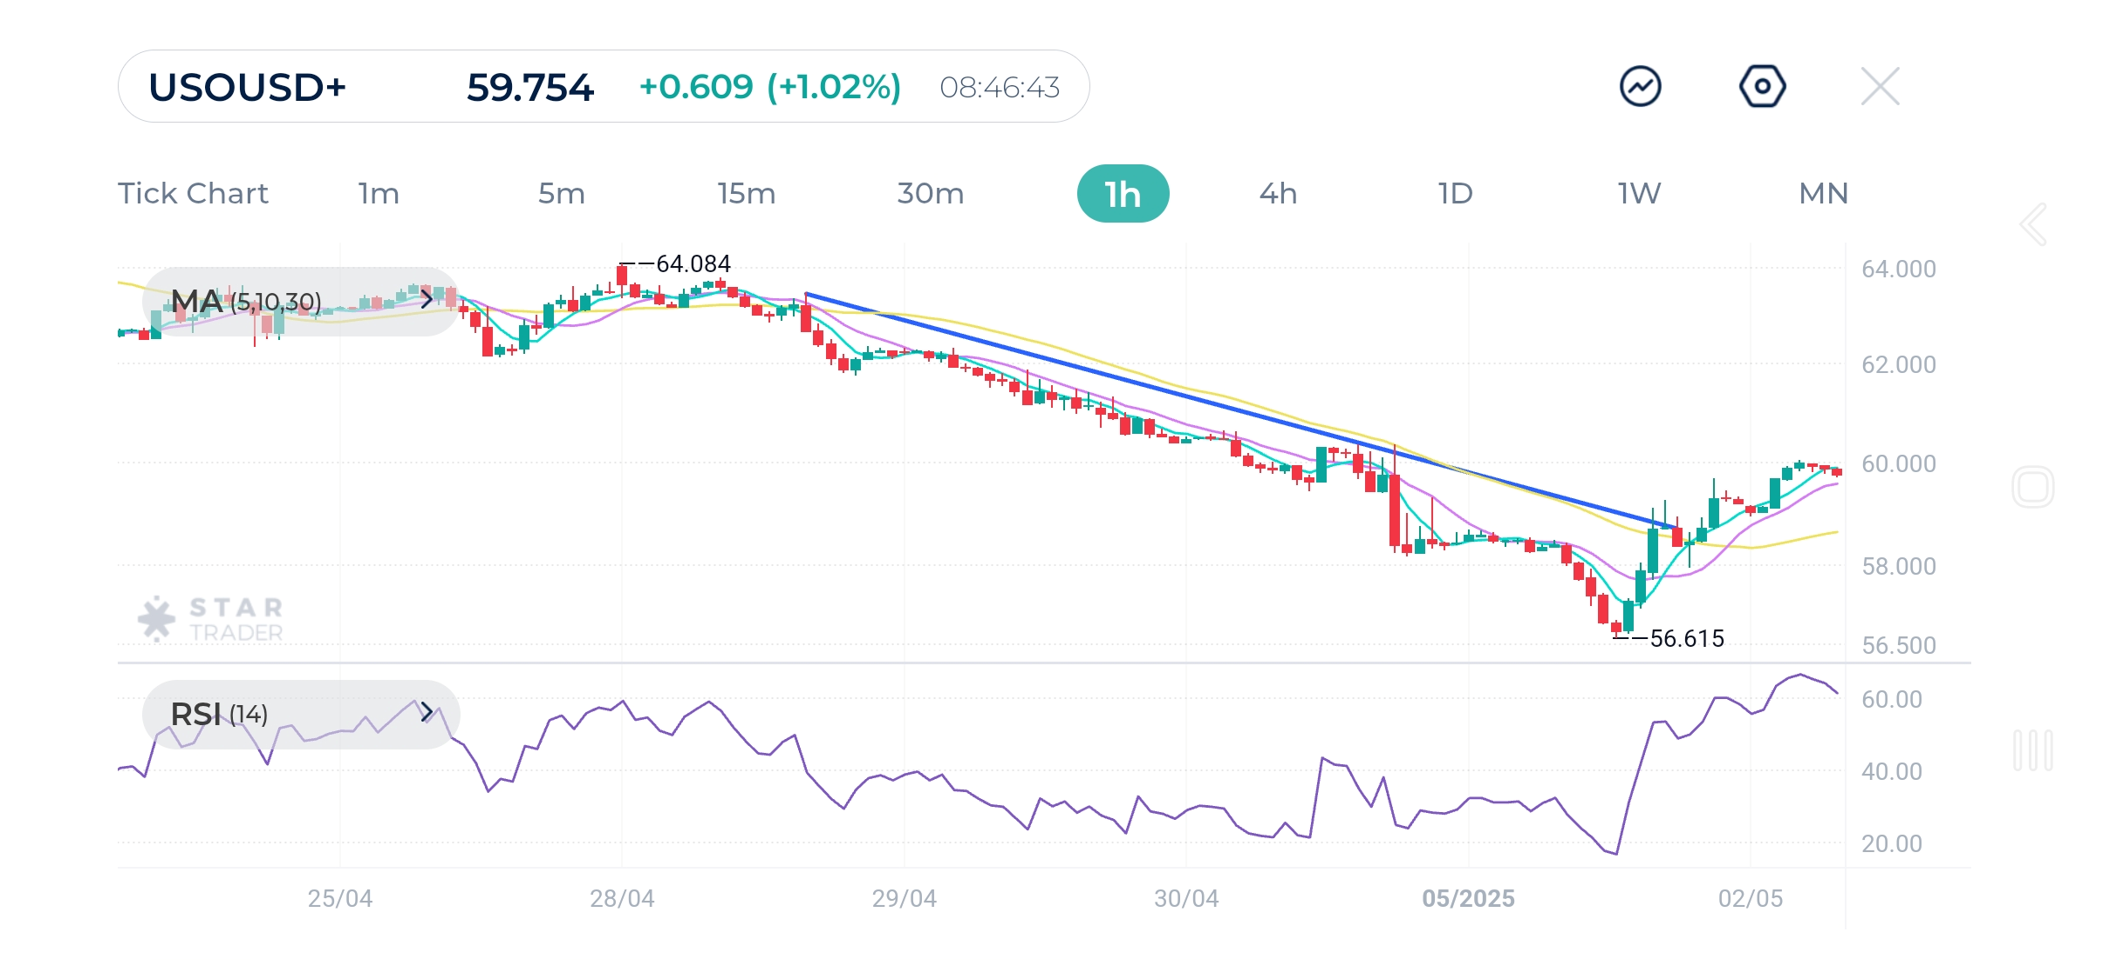
| Resistance | $59.83 | $60.13 | $60.81 |
| Support | $58.42 | $57.48 | $56.67 |
